|
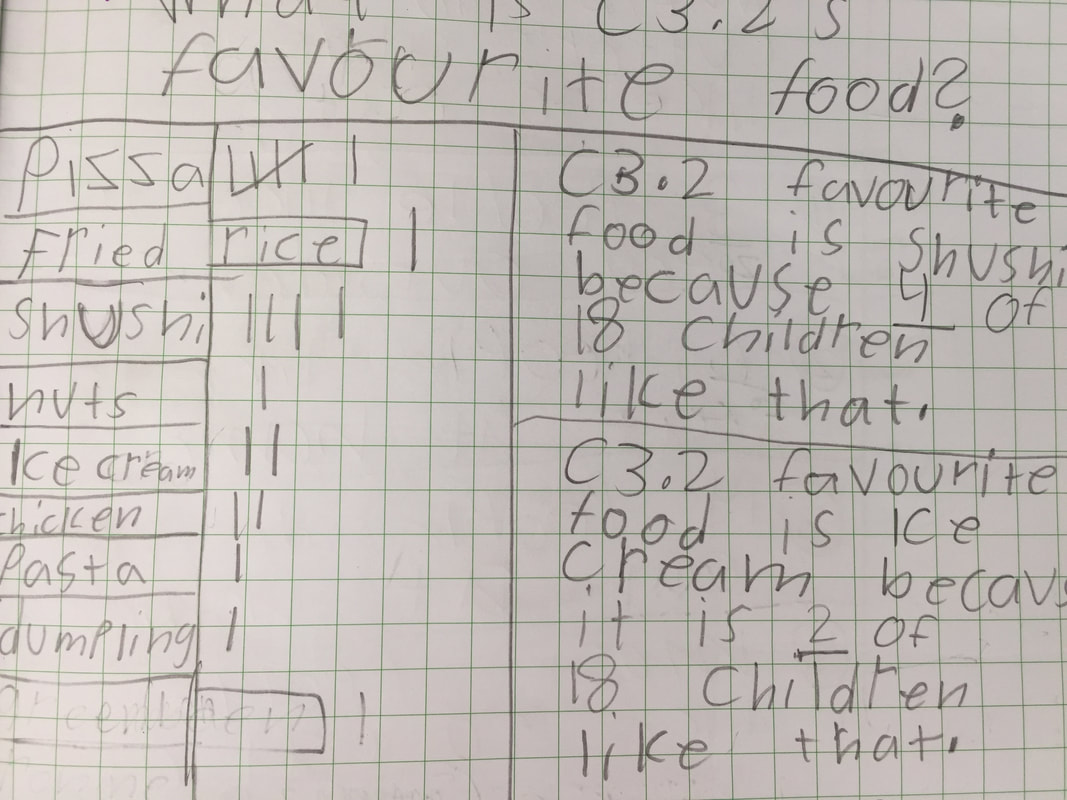
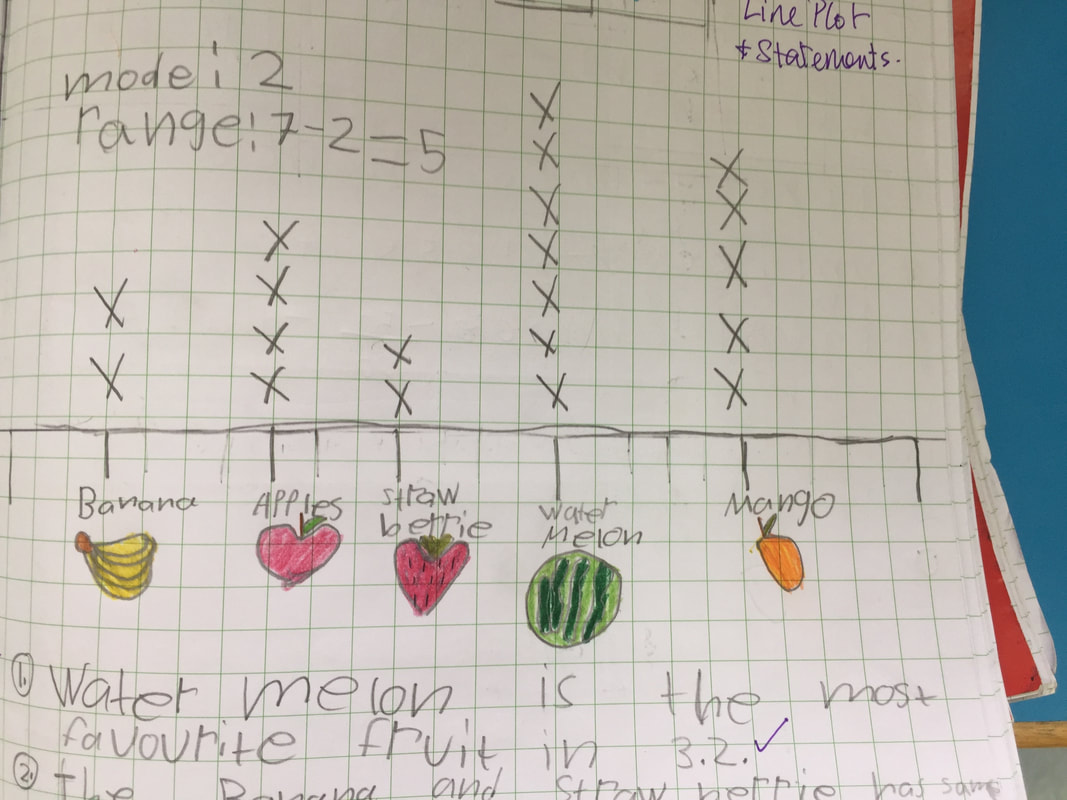
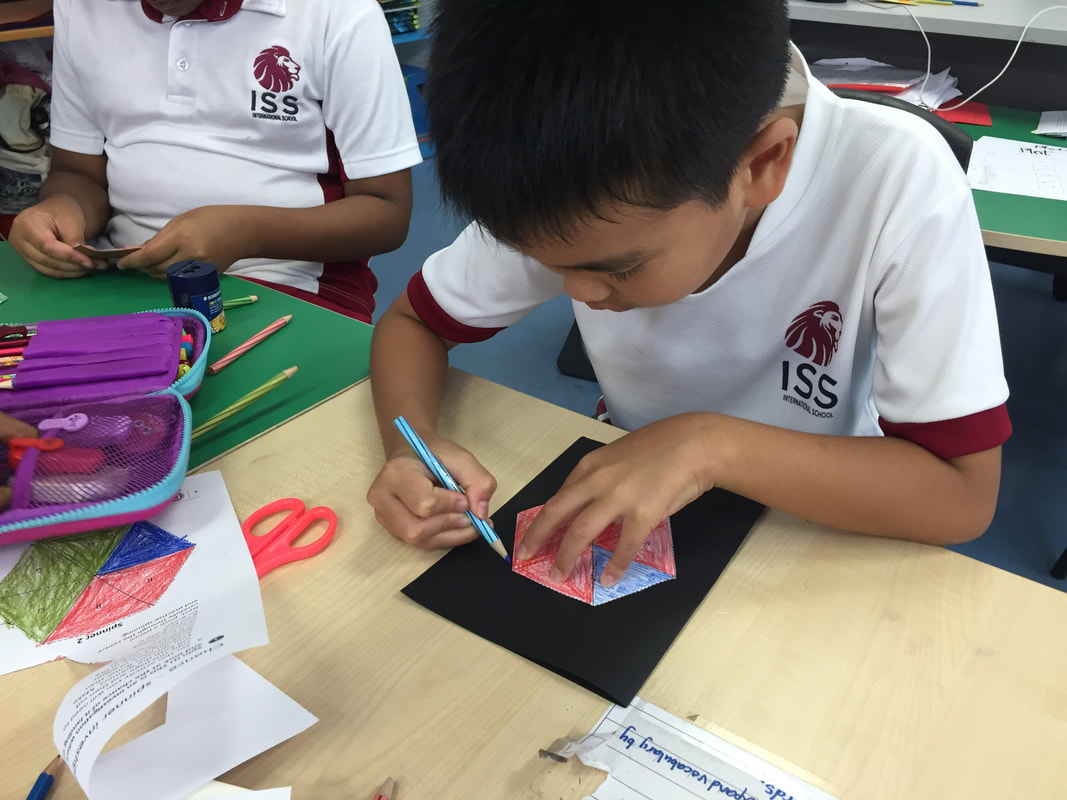
We designed surveys, collected data by interviewing all the grade three students. Then we learnt to use tally charts to keep a record. We organised data in line plots, line graphs and bar graphs to show change and to make comparisons. Next we made statements ... we looked at the data in the graphs to see what were big ideas we could infer from the information. Below, Taiga monitored his sleep over a week and arrived at these conclusions. 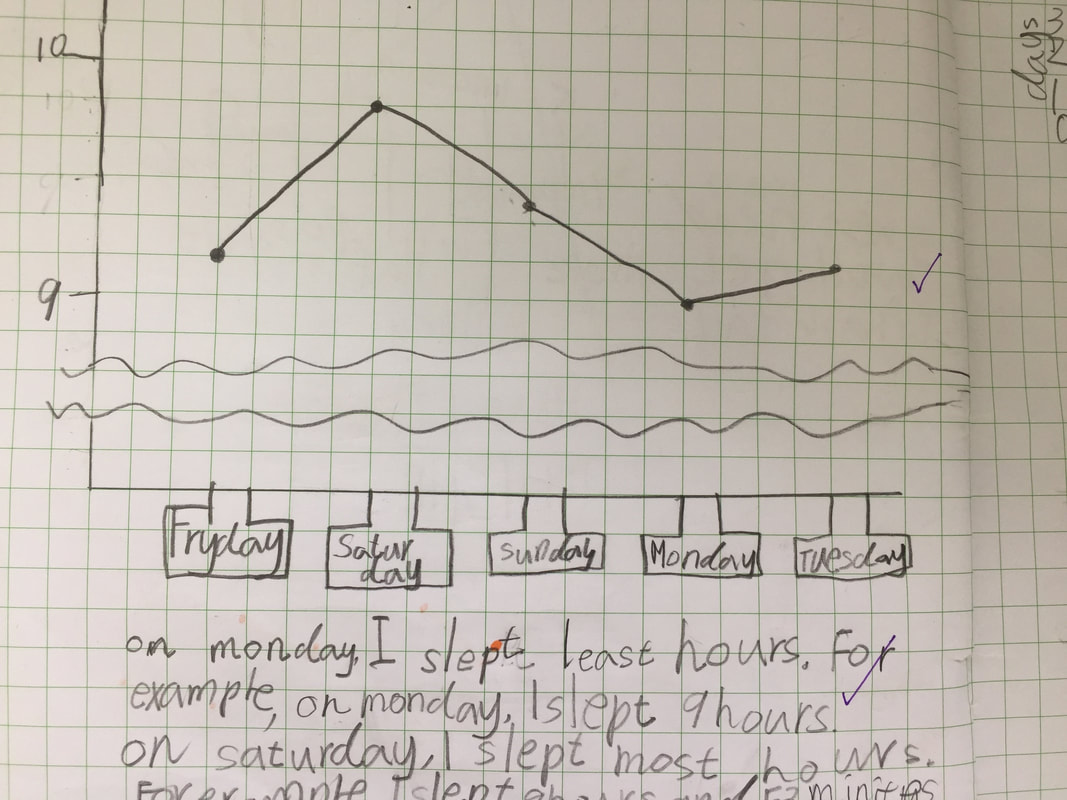 We made spinners and played games to deepen our understanding of probability. 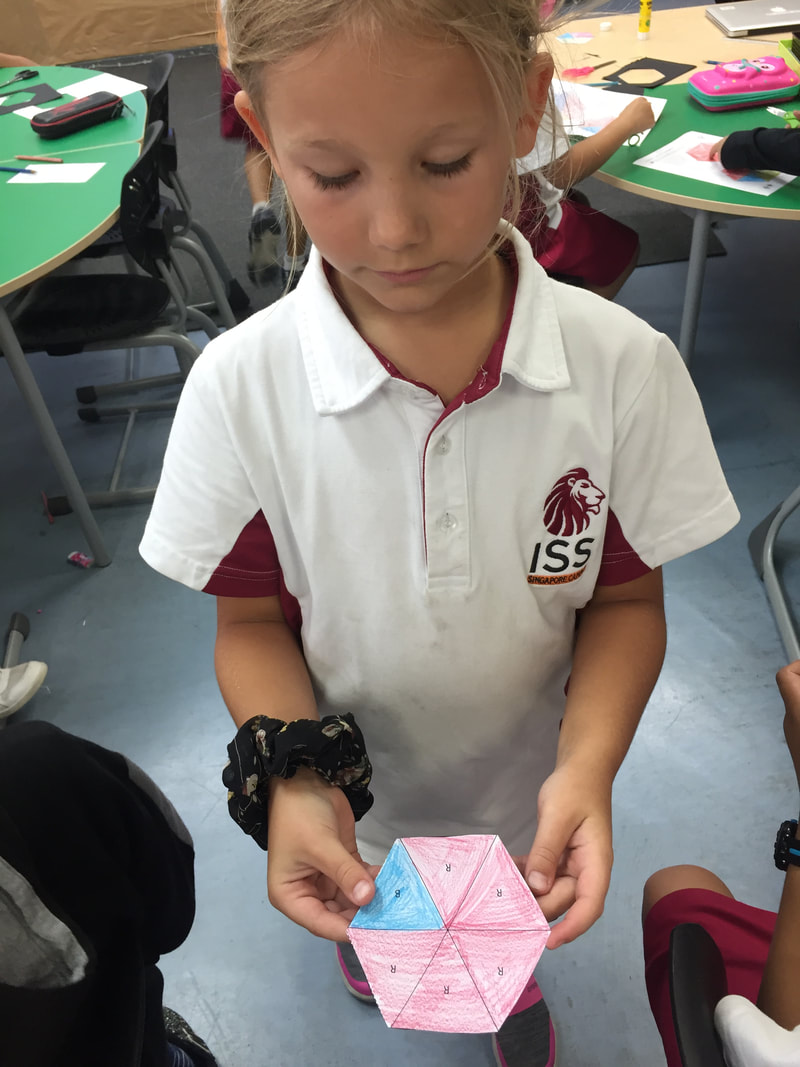 Goodbye Haruto!! HARUTO:
I joined ISS international school singapore in K2. My first teacher in K2 was Ms.Hinkel. When I joined ISS, my first friend was Stefan who is now also in y grade 3.2 class. I like been here because I like my teacher and all my friends like Shu, Rintaro, Stefan,Liam and more. My favourite subject is UOI because there is fun stuff like doing research. I feel sad about leaving ISS because I will miss all my friends and teachers. I am going back to Nagoya in Japan and I hope to come back soon to visit. RINTARO: I enjoy this week is Mandarin because I study hard. I made a question and answer in Mandarin. Then I can speak. Last week we made dumplings in Mandarin lesson. I did not like the taste. I don’t like this week is math because the math is harder and difficult. I found line graphs difficult. Line plot and bar graph are easier for me. We are learning about data handling. We made a question. My question was - what is grade 3’s favourite game. I asked 40 students. I found that the most popular game is switch. I will put the data in a bar graph. |
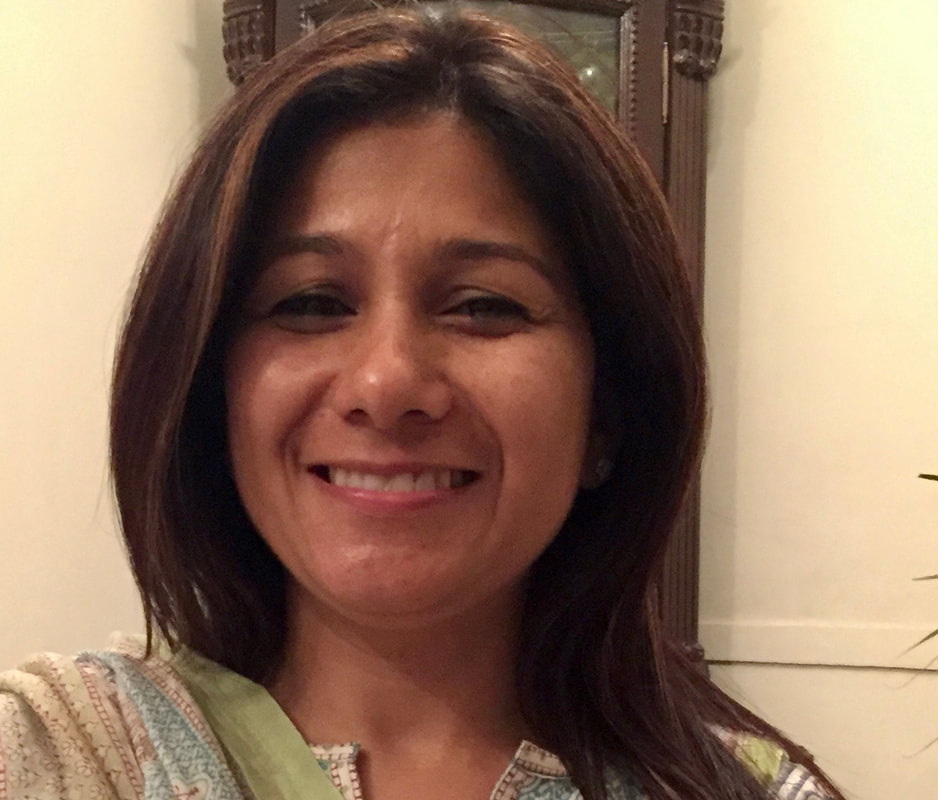
Shagun Batlaw
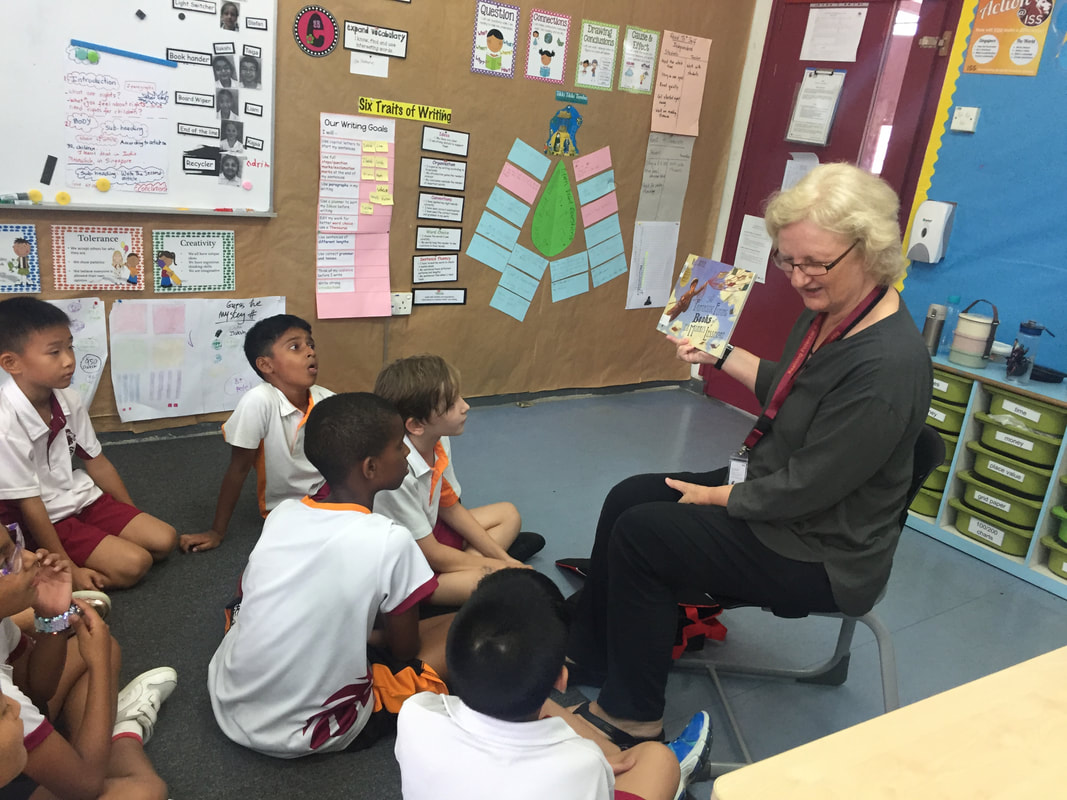
I am excited to work with 8 -9 year olds and view the world from their perspective. Archives
May 2019
Categories |


 RSS Feed
