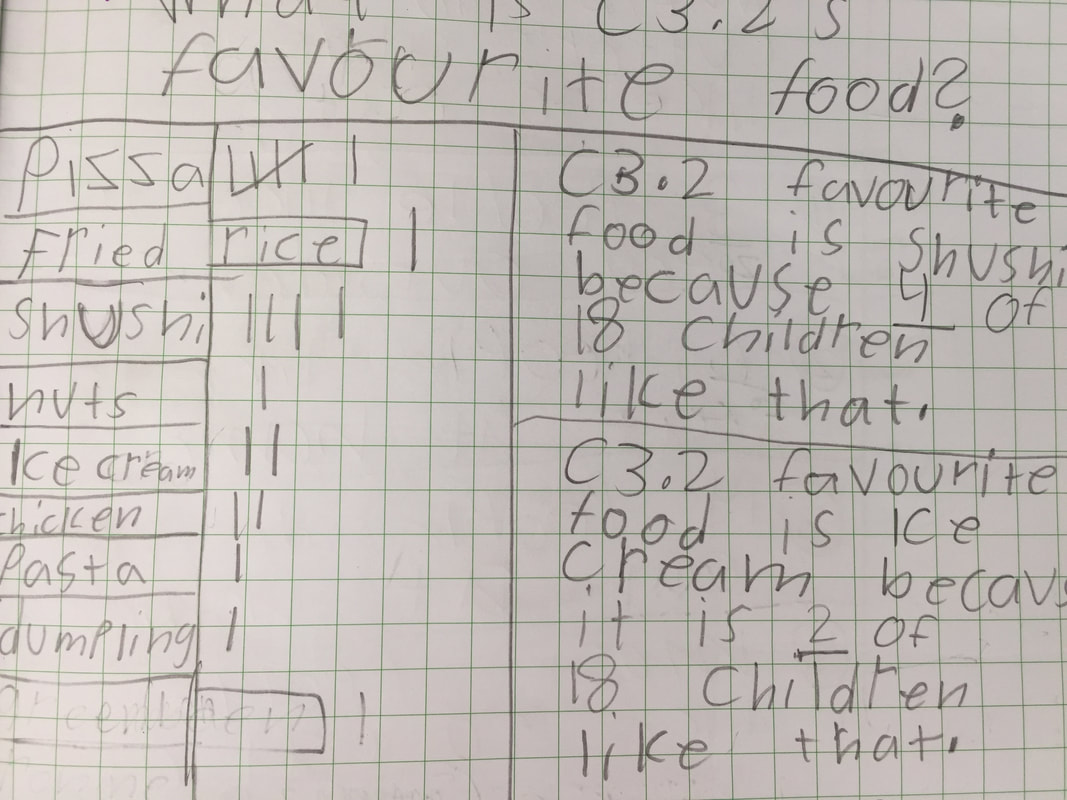
We designed surveys, collected data by interviewing all the grade three students. Then we learnt to use tally charts to keep a record.
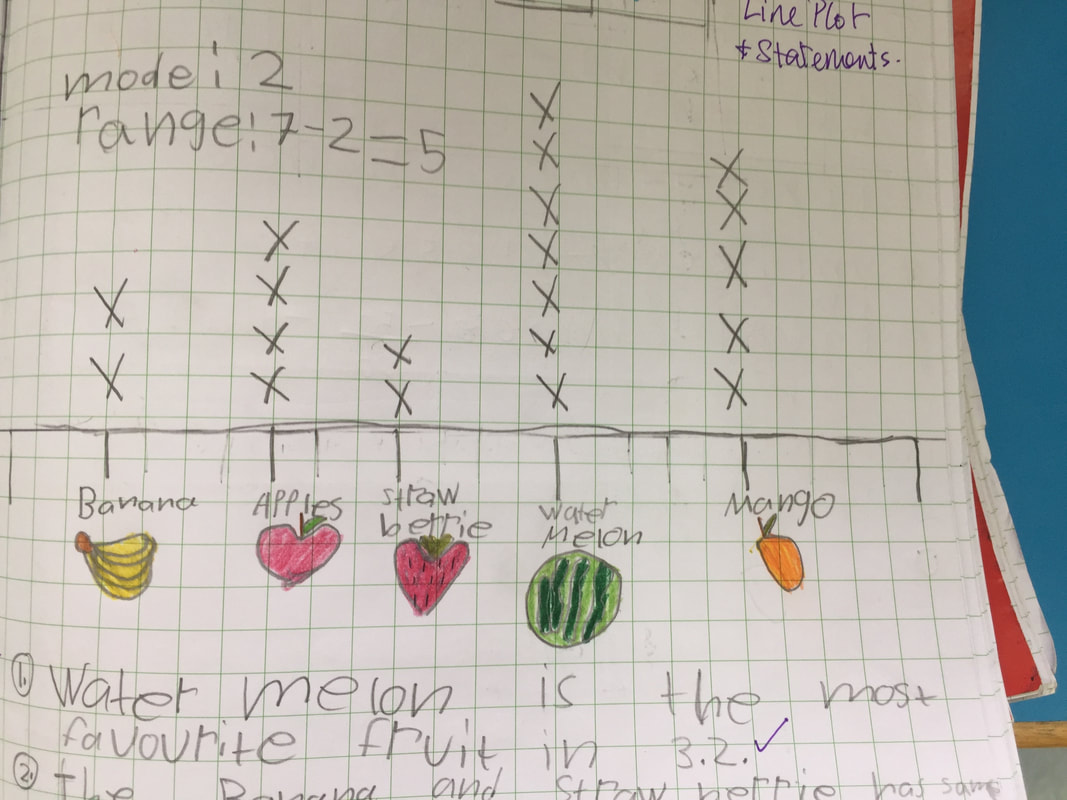
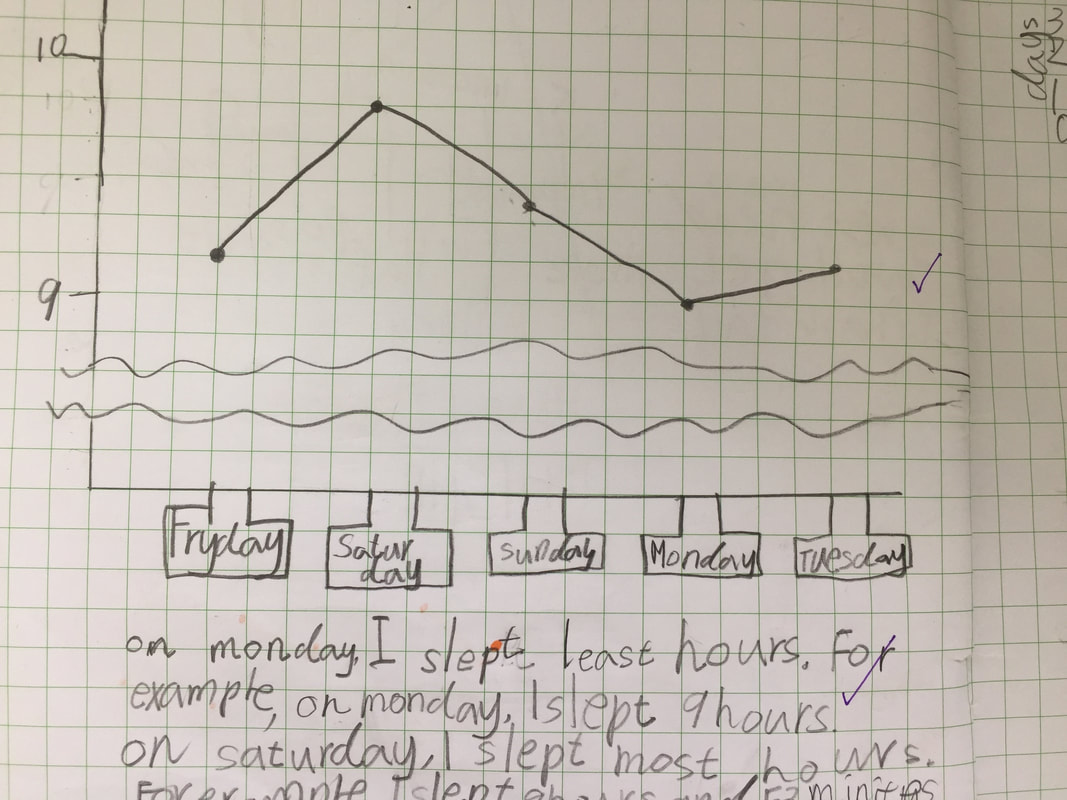
We organised data in line plots, line graphs and bar graphs to show change and to make comparisons. Next we made statements ... we looked at the data in the graphs to see what were big ideas we could infer from the information. Below, Taiga monitored his sleep over a week and arrived at these conclusions.
 RSS Feed
